
The inequality-made imbalances 3: Inequality, the savings amplifier
- Oct 4, 2021
- 7 min read
Updated: Aug 18, 2025
Savings concentrate in the top 20% of the income distribution while the top 1% is the super saver group.

The top 1%'s average income multiplied the US average income by 8 in 1980 and by 15 in 2020.
If 99% of the US population had dissaved as much as the top 1% saved, the US would not have needed new assets to store additional savings. Nevertheless, surging US liabilities since 1980s suggest otherwise.
The inequality series
As explained in detail in the inequality series 1, a savings equation should comprise gross financial savings and gross financial liabilities. At the global level, real and financial savings constitute the demand for assets whereas investment and financial liabilities constitute the supply of assets.
Real Savings + Financial Savings = Investment + Financial Liabilities
Ex-post, real savings equal investment and financial savings equal financial liabilities. Ex-ante, the equilibrium between the demand and supply is set by asset yields. Lower yields eat the excess desire to save by inhibiting savings and promoting asset supply whereas higher yields eat the excess desire to supply assets by promoting savings and inhibiting the asset supply.
The downwards trend in interest rates since 1981 all over the world implies a global excess saving desire over the asset supply desire. A global factor should be amplifying the global demand for real and financial assets.
10-year treasury rate

The inequality series 2, substantiates the strong domestic demand for US assets. Since 1980, US savers have acquired more US financial assets than foreigners. What might be the common factor amplifying savings both in the US and in the world? A US savings analysis can hint the global origins of excess savings.
Firms' neutrality on savings
Taking gross variables into consideration does not mean that all transactions related to the asset supply and demand have an impact on economic and financial variables. For the purpose of analysis, neutral transactions will be excluded on both sides of the asset supply and demand equation. Within financial liabilities, only consumption debt matters for an interest rate analysis as all other liability issuances equally increase the supply and demand of assets. Firms' all transactions are in this category. Whenever a firm purchases an asset, its equity or liability rises. Whenever a firm issues equity or liability, it purchases an asset.
In the US financial accounts, main categories are households, firms and government. In fact, there are only two. Firms are neutral in supplying or demanding assets. An illustration would materialize the neutrality of firms. This time, a firm, C, is incorporated into the model formulated for the series. A establishes C with zero equity. Instead of A, C produces a house for B on account. The house is $100 worth. C's income and B's spending rises for $100.
C's Assets: Financial Savings +$100
C's Liabilities: Labour Income (Equity) +$100
B's Assets: Investment +$100
B's Liabilities: Debt +$100
A's balance sheet:
A's Assets: C shares +$100
A's Liability: Equity +$100
The first lesson from the illustration is that firms' savings transfer into households. Firms' savings are equity. As real persons own all firms, any rise or fall in firms' equity would also transfer to their owners' balance sheet. C's $100 income also appears in A's balance sheet. To avoid duplicate counting of savings, firms' sectors will be excluded in the inequality analysis.
Equity is analyzed under the household sector because firms do not desire to save. The savings decision still belongs to A. A can return $100 equity to B by buying B's products. Firms save through making profits. Nevertheless, the final decision to keep or spend those savings belongs to their shareholders. Shareholders can add those profits to equity or decide to pay dividends. They can finally spend or save their dividend earnings.
The second lesson is in terms of the origin of savings. C's intermediation changed A's assets from debt to shares. Though, C shares are not the final asset. They came into existence, when C purchased B's debt. A's equity is backed by B's debt. Firms' net worth, assets less liabilities, are all backed by assets, by definition.
Firms' savings, equity, is a final asset form only in one case. The difference between the market and book value of a firm's equity has no asset backing. In the illustration, $100 are the equity's book value. Multiplying the firm's total number of shares with the stock price, the market value is calculated. A market value over the book value is the equity-originated savings. If C's market value is $150, the margin between the market and book value, $50 are equity-originated whereas $100 are debt-originated. By the end of 2020, equities total $41.96 trillion, net worth (book value) total $25.83 trillion in the US financial accounts. US corporations thus supply $16.13 trillion equity-originated assets to store savings.
Inequality as the savings amplifier
Among the remaining two sectors, the saver and saving supplier sector is obvious. Government produces financial savings for households via issuing treasuries.
By the end of 2020, the US households' total assets, total liabilities and net worth amount to $148 trillion, $17.1 trillion and $131 trillion, respectively. As the chart illustrates, households' asset growth has accelerated over the decades whereas their liabilities has been steady since the GFC.
An analysis based on gross variables would take $148 trillions into consideration. Nevertheless, not all $17.1 trillion is a net liability source. Only consumption debt within total household liabilities increases the net asset supply. By the end of 2020, $10.9 trillion of $17.1 trillion were invested in home mortgages. As each mortgage creates an asset demand and supply in the same amount, mortgage issuance is neutral on interest rates. Households' supply of financial assets could be at most $6.2 trillion worth of consumer credit and other liabilities. It is still not clear how much of this amount is invested in acquiring a real or financial asset, such as stocks or houses. Though, households surely demanded $131 trillion new assets, making households' net worth a better proxy to assess the demand for assets.
Households and nonprofit organizations

Households' net worth-to-disposable income ratio implies a structural change since 1980s. The upwards trend in the household saving ratio started in 1984. Since then, households' strong saving desire has been incentivizing asset production through lower interest rates and higher asset prices.

No income group dissaved against the top 1%
Income and wealth distributions signal the origins of the high saving desire. The top 1% is the super saver group both in stock and flow values. Between 1989 and 2020, the top 1%'s wealth share had grown from 17.3% to 26.1%. The top 1%'s income compared to the average US income explains the rise in their wealth share. The top 1%'s income multiplied the average US income by 8 in 1980 and by 15 in 2019. The next 19%'s income to the US average slightly rose while the bottom 80% groups' ratios all fell.
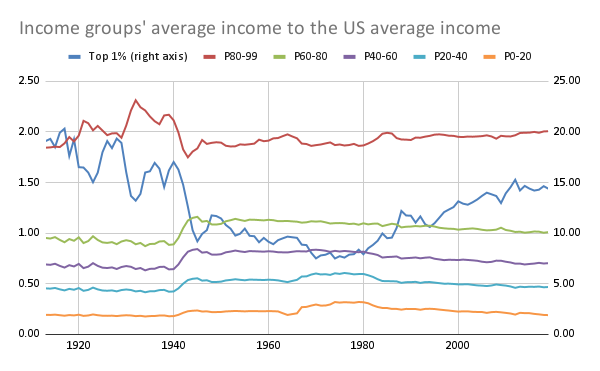
Source: World Inequality Database
Rising income inequality amplifies the top 1%'s saving desire. In average, a household in the top 1% saved 17 times of the household in the next 19% saved. All other groups lost wealth share against the top 1%. The losses in the 80-99%, 60-80%, 40-60%, 20-40% and 0-20% groups are 0.7, 1.3, 4.8, 3.2 and 0.1 percentage points. The biggest losers are between 20% and 60% of the income distribution.
By 2020, the top 1% earners hold 26.1% of wealth in the US. The next 19% (between 81-99%)'s wealth accounts for 44.4% of wealth. The wealth share falls to 15.4%, 7.3%, 4.1% and 2.8% in the 60-80%, 40-60%, 20-40% and 0-20% income groups.

If 99% of the US population had dissaved as much as the top 1% saved, the US would not have needed new assets to store additional savings. Nevertheless, surging US liabilities since 1980s suggest otherwise. No income group had dissaved between 1989 and 2019.
Based on distributional US financial accounts, the income groups in the top 40%, who earn equal to or more than the US average income, had increased their savings. From 1989 to 2020, the top 1% increased their wealth from 0.6 GDP to 1.5 GDP whereas the 80-99% and 60-80% groups' wealth rose from 1.6 GDP to 2.6 GDP and 0.6 GDP to 0.9 GDP.

Autonomous savings
The surprising part of the story is in the remaining 60% of the population who earn less than the US average. Their wealth to GDP had not fallen although their earnings to GDP had fallen. Moreover, 0-20% groups' wealth rose from 0.1 GDP to 0.2 GDP. The 20-40% and 40-60% groups' wealth to GDP ratio had been steady.
The bottom 60% tell a story about the saving behavior. The bottom 60%'s savings rose faster than their earnings. Such a behavior suggests ''autonomous savings'' that are less affected than consumption in the underperforming groups.
Why do underperforming bottom groups prefer to save more of their income and consume less? Income groups' asset compositions hint why. Housing constitutes a bigger portion of wealth in lower income groups. That is to say, living in own house is a strong incentive to save. Underperforming income groups prefer to consume less proportional to their income in order to serve mortgage installments.
Owning a house requires to increase savings at the GDP growth level as the GDP and house prices have historically risen in tandem in the US. To be able to own a house, the bottom 60% increased their savings at the GDP growth level despite an income performance under the GDP growth. Housing thus constitutes households' autonomous savings. Households adjust their savings to house prices even though their income does not rise as much as house prices do.
House price index and gross domestic product in the US

The rich save more as they get richer. The poor save more of their income in order to own a house although they earn a smaller portion of aggregate income. The household sector's desire to save has thus been surging since 1980s.


Comments